| | ||||
 |
|
|||
 >4x >4x |
Module 123 |
| General Properties | |
|---|---|
| Below we list the number of gene sets from which the module was composed was originally composed, and the number of genes and experiments that it contains. Clicking on the number of genes will display a detailed list of all the genes in the module. Clicking on the number of experiments will display a detailed list of all the experiments in the module. | |
| Num gene sets: | 2 |
| Num genes: | 249 (see 1630 additional genes for this module) |
| Num experiments: | 490 (148 induced, 342 repressed) |
| Parent module: | 197 |
| Children modules: | None |
| Gene sets | |
|---|---|
| Below we list the gene sets from which the module was originally composed. Clicking on a gene set will display all the genes associated with that gene set. Also listed are all the other modules in which the gene set participates. | |
| sensory perception | |
| chemosensory perception | |
| Enriched clinical annotations | |||||||
|---|---|---|---|---|---|---|---|
| For each of the clinical annotations, we tested whether it was enriched in the set of arrays in which the module is significantly induced (or repressed). Below we list all such annotations that were enriched in this module with an FDR corrected p-value of 0.05 ('P-value' column), along with the number ('Hits' column) of induced (or repressed) module's arrays in which they appear. We also show the fraction of the module's induced (or repressed) arrays with the given annotation ('Hits (%)' column). For completeness, we also list the total number of relevant induced arrays in the module ('Module hits in category' column), total number of arrays in the compendium in which the corresponding annotation is present ('Arrays in annotation' column), and the total number of relevant arrays in the compendium ('Arrays' column). Note that the 'relevant' arrays may be different for each annotation, since it includes only arrays in which the annotation was relevant (i.e., present or not present) and excludes arrays where the value of the annotation was not known. Rows that correspond to annotations that were enriched in the induced arrays of the module have a red background, while rows corresponding to annotations enriched in the repressed arrays have a green background. For each annotation, we also list the other modules in which it was enriched. | |||||||
| Clinical annotation | Category | P-value | Hits | Hits(%) | Module hits in category | Arrays in annotation | Arrays |
| Cancer and cell line (Various tumors*) | Various tumors* | 3.8e-41 | 79 | 23.0 | 342 | 105 | 1945 |
| Cancer (Various tumors*) | Various tumors* | 3.8e-41 | 79 | 23.0 | 342 | 105 | 1945 |
| Lymphoma (B lymphoma) | B lymphoma | 1.1e-15 | 38 | 82.6 | 46 | 77 | 245 |
| Acute leukemia (Leukemia*) | Leukemia* | 9.5e-14 | 61 | 17.8 | 342 | 141 | 1945 |
| Cancer and cell line (Leukemia*) | Leukemia* | 9.5e-14 | 61 | 17.8 | 342 | 141 | 1945 |
| Cancer (Leukemia*) | Leukemia* | 9.5e-14 | 61 | 17.8 | 342 | 141 | 1945 |
| Hematologic cancer and cell line (Leukemia*) | Leukemia* | 9.5e-14 | 61 | 17.8 | 342 | 141 | 1945 |
| Hematologic cancer (Leukemia*) | Leukemia* | 9.5e-14 | 61 | 17.8 | 342 | 141 | 1945 |
| Hematologic samples and cell lines (Leukemia*) | Leukemia* | 9.5e-14 | 61 | 17.8 | 342 | 141 | 1945 |
| Leukemia (Leukemia*) | Leukemia* | 9.5e-14 | 61 | 17.8 | 342 | 141 | 1945 |
| Leukemia or leukemia cell line (Leukemia*) | Leukemia* | 9.5e-14 | 61 | 17.8 | 342 | 141 | 1945 |
| Monocytes (Leukemia*) | Leukemia* | 9.5e-14 | 61 | 17.8 | 342 | 141 | 1945 |
| Hematologic cancer and cell line (Stimulated immune*) | Stimulated immune* | 2.2e-09 | 19 | 12.8 | 148 | 53 | 1945 |
| Hematologic samples and cell lines (Stimulated immune*) | Stimulated immune* | 2.2e-09 | 19 | 12.8 | 148 | 53 | 1945 |
| Macrophages (Stimulated immune*) | Stimulated immune* | 2.2e-09 | 19 | 12.8 | 148 | 53 | 1945 |
| Monocytes (Stimulated immune*) | Stimulated immune* | 2.2e-09 | 19 | 12.8 | 148 | 53 | 1945 |
| Hematologic samples and cell lines (B lymphoma) | B lymphoma | 3.1e-07 | 38 | 82.6 | 46 | 121 | 245 |
| Non-tumor liver tissue (Liver cancer) | Liver cancer | 7.9e-07 | 26 | 74.2 | 35 | 76 | 207 |
| Liver tissue (Liver cancer*) | Liver cancer* | 3.7e-06 | 32 | 21.6 | 148 | 187 | 1945 |
| Liver tissue, cancer or cell line (Liver cancer*) | Liver cancer* | 1.2e-05 | 32 | 21.6 | 148 | 197 | 1945 |
| Adenocarcinoma (Various tumors) | Various tumors | 2.1e-05 | 37 | 30.8 | 120 | 37 | 154 |
| Stimulated immune cells (Stimulated PBMC*) | Stimulated PBMC* | 0.0001 | 24 | 16.2 | 148 | 143 | 1945 |
| Cancer and cell line (Lung cancer*) | Lung cancer* | 0.0001 | 35 | 23.6 | 148 | 252 | 1945 |
| Cancer (Lung cancer*) | Lung cancer* | 0.0001 | 35 | 23.6 | 148 | 252 | 1945 |
| Lung tissue, cancer or cell line (Lung cancer*) | Lung cancer* | 0.0001 | 37 | 25 | 148 | 276 | 1945 |
| Unstimulated immune cells (Stimulated PBMC) | Stimulated PBMC | 0.0003 | 5 | 100 | 5 | 39 | 182 |
| Normal tissue (Liver cancer) | Liver cancer | 0.0004 | 8 | 22.8 | 35 | 14 | 207 |
| Enriched GO annotations | ||||||
|---|---|---|---|---|---|---|
| For each GO annotation, we tested whether it was enriched in the set of genes of the module. Below we list all such annotations that were enriched in this module with an FDR corrected p-value of 0.05 ('P-value' column), along with the number ('Hits' column) of the module's genes in which they appear. We also show the fraction of the module's genes with the given GO annotation that are included in this module ('Hits (%)' column). For completeness, we also list the total number of genes in the module ('Module genes' column), total number of genes in the compendium in which the corresponding annotation is present ('Genes in annotation' column), and the total number of genes in the compendium ('Genes' column). | ||||||
| GO annotation | P-value | Hits | Hits(%) | Module genes | Genes in annotation | Genes |
| sensory perception | 1.8e-222 | 249 | 100 | 249 | 700 | 4566 |
| chemosensory perception | 1.4e-219 | 247 | 99.1 | 249 | 682 | 4566 |
| response to abiotic stimulus | 1.7e-151 | 249 | 100 | 249 | 1228 | 4566 |
| regulation of transcription\, DNA-dependent | 3.9e-137 | 197 | 79.1 | 249 | 595 | 4566 |
| transcription regulator activity | 1.9e-105 | 186 | 74.6 | 249 | 703 | 4566 |
| nucleus | 3.8e-77 | 185 | 74.2 | 249 | 966 | 4566 |
| transcription factor activity | 2.3e-76 | 121 | 48.5 | 249 | 340 | 4566 |
| endomembrane system | 8.3e-68 | 181 | 72.6 | 249 | 1029 | 4566 |
| DNA binding | 9.7e-29 | 77 | 30.9 | 249 | 357 | 4566 |
| regulation of transcription by pheromones | 5.3e-28 | 46 | 18.4 | 249 | 123 | 4566 |
| regulation of transcription from Pol II promoter | 2.6e-27 | 49 | 19.6 | 249 | 146 | 4566 |
| conjugation without cellular fusion | 2.1e-26 | 49 | 19.6 | 249 | 152 | 4566 |
| RNA polymerase II transcription factor activity | 6.1e-19 | 34 | 13.6 | 249 | 102 | 4566 |
| transcription from Pol II promoter | 7.8e-19 | 38 | 15.2 | 249 | 130 | 4566 |
| transcription factor binding | 2.0e-18 | 36 | 14.4 | 249 | 119 | 4566 |
| transcription cofactor activity | 6.7e-18 | 36 | 14.4 | 249 | 123 | 4566 |
| G-protein coupled receptor protein signaling pathway | 1.6e-16 | 49 | 19.6 | 249 | 245 | 4566 |
| phosphorus metabolism | 1.2e-13 | 33 | 13.2 | 249 | 138 | 4566 |
| transcription co-activator activity | 3.4e-13 | 24 | 9.6 | 249 | 75 | 4566 |
| phosphate metabolism | 2.7e-12 | 33 | 13.2 | 249 | 153 | 4566 |
| phosphorylation | 6.9e-12 | 35 | 14.0 | 249 | 176 | 4566 |
| G-protein coupled receptor activity | 5.8e-11 | 33 | 13.2 | 249 | 170 | 4566 |
| regulation of transcription from Pol II promoter by pheromones | 1.8e-09 | 14 | 5.6 | 249 | 36 | 4566 |
| rhodopsin-like receptor activity | 2.9e-09 | 28 | 11.2 | 249 | 147 | 4566 |
| conjugation with cellular fusion | 1.9e-07 | 10 | 4.0 | 249 | 24 | 4566 |
| oncogenesis | 4.6e-07 | 28 | 11.2 | 249 | 184 | 4566 |
| transcription co-repressor activity | 1.7e-06 | 12 | 4.8 | 249 | 43 | 4566 |
| steroid hormone receptor activity | 5.0e-06 | 9 | 3.6 | 249 | 26 | 4566 |
| chromatin | 1.0e-05 | 12 | 4.8 | 249 | 50 | 4566 |
| death | 1.2e-05 | 38 | 15.2 | 249 | 342 | 4566 |
| ligand-dependent nuclear receptor activity | 1.4e-05 | 9 | 3.6 | 249 | 29 | 4566 |
| development | 1.8e-05 | 53 | 21.2 | 249 | 554 | 4566 |
| nucleoplasm | 1.8e-05 | 16 | 6.4 | 249 | 89 | 4566 |
| regulation of cell proliferation | 4.0e-05 | 14 | 5.6 | 249 | 75 | 4566 |
| inflammatory response | 6.0e-05 | 17 | 6.8 | 249 | 108 | 4566 |
| transcription factor complex | 6.2e-05 | 8 | 3.2 | 249 | 27 | 4566 |
| histogenesis and organogenesis | 9.2e-05 | 10 | 4.0 | 249 | 44 | 4566 |
| specific RNA polymerase II transcription factor activity | 0.0001 | 6 | 2.4 | 249 | 16 | 4566 |
| negative regulation of cell proliferation | 0.0001 | 13 | 5.2 | 249 | 73 | 4566 |
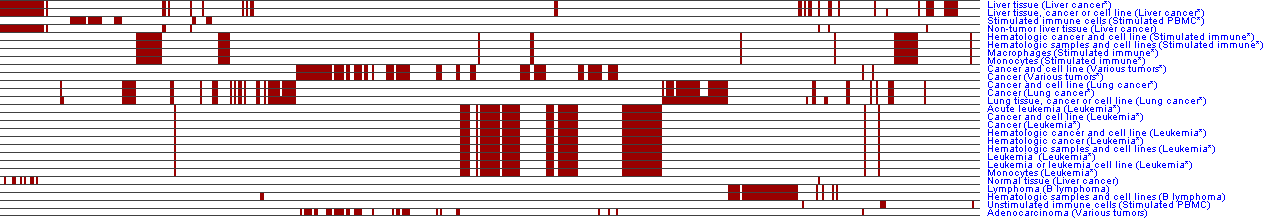
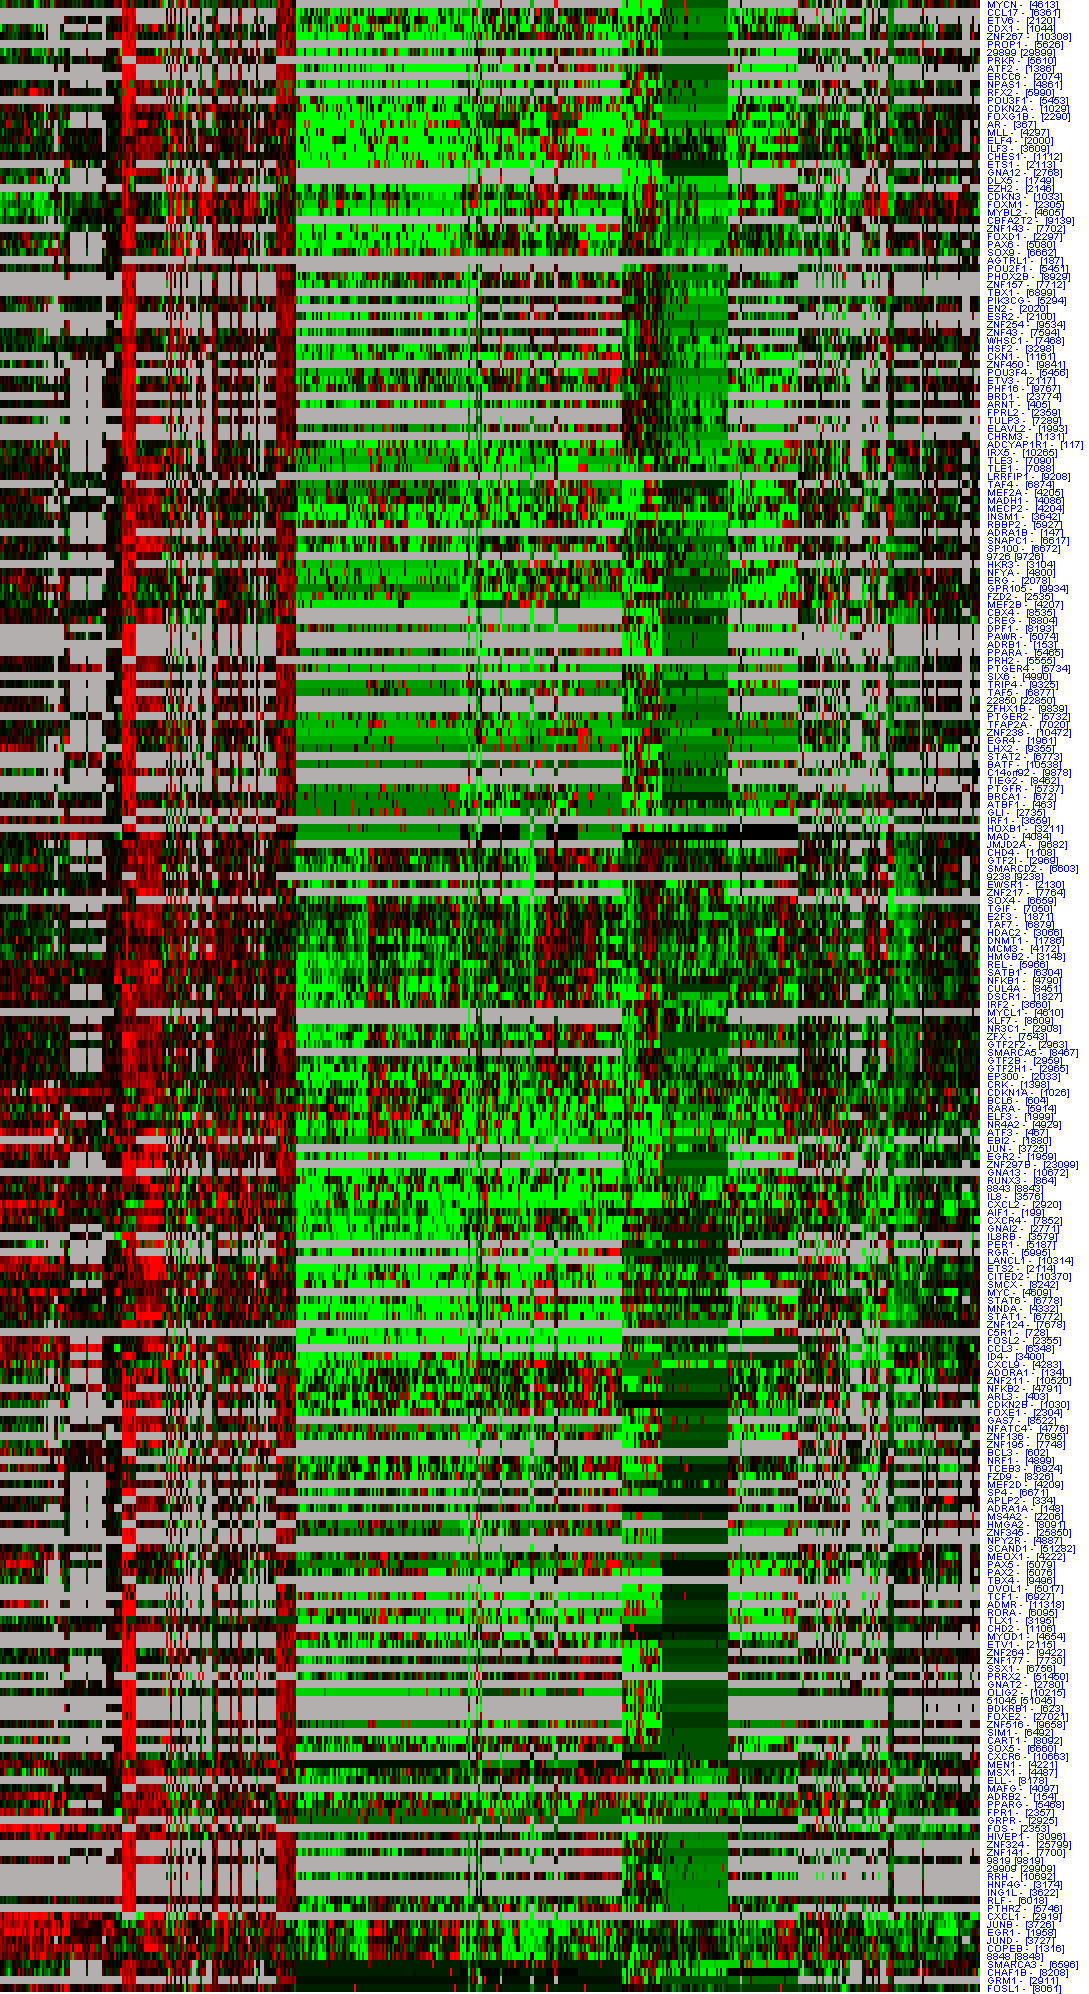
| Visual display | |||||||||
|---|---|---|---|---|---|---|---|---|---|
| Below is a visual display of the module. Shown are those arrays in which the module's genes significantly change, and the direction of change (induction/repression) in each array is indicated (middle, labeled 'Module changes'; red/green row). The arrays that correspond to the significant clinical attributes are also shown (top; brown rows). The gene sets that compose the module are also shown (left) along with an indication of the membership of the module genes in these gene sets. | |||||||||
| You can also view the images within GeneXPress by loading the module gxp file file. | |||||||||
| Note: Since there are 490 experiments, this image does not display the individual experiment names, but rather condenses each experiment to a single pixel without displaying its name. You can fully view the image for this module within GeneXPress, by loading any of the four files mentioned in the line above | |||||||||
|
|||||||||