| Enriched clinical annotations |
|---|
| For each of the clinical annotations, we tested whether it was enriched in the set of arrays in which the module is significantly induced (or repressed). Below we list all such annotations that were enriched in this module with an FDR corrected p-value of 0.05 ('P-value' column), along with the number ('Hits' column) of induced (or repressed) module's arrays in which they appear. We also show the fraction of the module's induced (or repressed) arrays with the given annotation ('Hits (%)' column). For completeness, we also list the total number of relevant induced arrays in the module ('Module hits in category' column), total number of arrays in the compendium in which the corresponding annotation is present ('Arrays in annotation' column), and the total number of relevant arrays in the compendium ('Arrays' column). Note that the 'relevant' arrays may be different for each annotation, since it includes only arrays in which the annotation was relevant (i.e., present or not present) and excludes arrays where the value of the annotation was not known. Rows that correspond to annotations that were enriched in the induced arrays of the module have a red background, while rows corresponding to annotations enriched in the repressed arrays have a green background. For each annotation, we also list the other modules in which it was enriched. |
| Clinical annotation |
Category |
P-value |
Hits |
Hits(%) |
Module hits in category |
Arrays in annotation |
Arrays |
| Liver tissue (Liver cancer*) |
Liver cancer* |
1.3e-59 |
126 |
37.2 |
338 |
187 |
1945 |
| Liver tissue, cancer or cell line (Liver cancer*) |
Liver cancer* |
1.5e-55 |
126 |
37.2 |
338 |
197 |
1945 |
| Hepatitis infected liver (Liver cancer*) |
Liver cancer* |
5.0e-43 |
100 |
29.5 |
338 |
156 |
1945 |
| Lung tissue, cancer or cell line (Lung cancer*) |
Lung cancer* |
2.6e-37 |
209 |
26.3 |
792 |
276 |
1945 |
| Cancer and cell line (Lung cancer*) |
Lung cancer* |
2.1e-35 |
193 |
24.3 |
792 |
252 |
1945 |
| Cancer (Lung cancer*) |
Lung cancer* |
2.1e-35 |
193 |
24.3 |
792 |
252 |
1945 |
| Lung cancer (Lung cancer*) |
Lung cancer* |
2.8e-32 |
181 |
22.8 |
792 |
238 |
1945 |
| Lung cancer or cell line (Lung cancer*) |
Lung cancer* |
2.8e-32 |
181 |
22.8 |
792 |
238 |
1945 |
| Non small cell lung cancer and cell line (Lung cancer*) |
Lung cancer* |
7.2e-30 |
159 |
20.0 |
792 |
205 |
1945 |
| Non small cell lung cancer (Lung cancer*) |
Lung cancer* |
7.2e-30 |
159 |
20.0 |
792 |
205 |
1945 |
| Cancer and cell line (Liver cancer) |
Liver cancer |
2.3e-21 |
72 |
100 |
72 |
126 |
207 |
| Non-tumor liver tissue (Liver cancer) |
Liver cancer |
4.0e-19 |
74 |
58.7 |
126 |
76 |
207 |
| Prostate (Prostate cancer*) |
Prostate cancer* |
9.6e-17 |
81 |
10.2 |
792 |
101 |
1945 |
| Acute lymphocytic leukemia (Leukemia) |
Leukemia |
2.1e-14 |
65 |
97.0 |
67 |
99 |
149 |
| Lymphocytes (Leukemia) |
Leukemia |
4.9e-13 |
57 |
96.6 |
59 |
91 |
141 |
| Cancer (Liver cancer) |
Liver cancer |
2.4e-11 |
62 |
86.1 |
72 |
115 |
207 |
| B cells (Leukemia) |
Leukemia |
3.4e-11 |
45 |
76.2 |
59 |
62 |
141 |
| Hematologic samples and cell lines (Various tumors) |
Various tumors |
2.6e-10 |
36 |
41.8 |
86 |
37 |
154 |
| Hematologic samples (Various tumors) |
Various tumors |
2.6e-10 |
36 |
41.8 |
86 |
37 |
154 |
| Bone marrow (Leukemia) |
Leukemia |
4.7e-09 |
22 |
37.2 |
59 |
23 |
141 |
| Diffuse large B cell lymphoma - DLBCL (B lymphoma) |
B lymphoma |
2.4e-08 |
31 |
93.9 |
33 |
126 |
245 |
| Hematologic cancer and cell line (Various tumors) |
Various tumors |
2.8e-08 |
30 |
34.8 |
86 |
31 |
154 |
| Hematologic cancer (Various tumors) |
Various tumors |
2.8e-08 |
30 |
34.8 |
86 |
31 |
154 |
| Primary blood mononuclear cells (Various tumors) |
Various tumors |
2.8e-08 |
30 |
34.8 |
86 |
31 |
154 |
| Adenocarcinoma (Liver cancer) |
Liver cancer |
7.6e-08 |
52 |
72.2 |
72 |
97 |
207 |
| Diffuse large B cell lymphoma tumor or cell line (B lymphoma) |
B lymphoma |
1.8e-07 |
31 |
93.9 |
33 |
134 |
245 |
| Lymphocytes (Various tumors) |
Various tumors |
2.6e-07 |
27 |
31.3 |
86 |
28 |
154 |
| Monocytes (Various tumors) |
Various tumors |
2.6e-07 |
27 |
31.3 |
86 |
28 |
154 |
| Cancer and cell line (Various tumors*) |
Various tumors* |
2.7e-07 |
68 |
8.5 |
792 |
105 |
1945 |
| Cancer (Various tumors*) |
Various tumors* |
2.7e-07 |
68 |
8.5 |
792 |
105 |
1945 |
| Invasive liver tumor (Liver cancer) |
Liver cancer |
4.7e-07 |
27 |
37.5 |
72 |
38 |
207 |
| Breast tissue or cancer (Breast cancer*) |
Breast cancer* |
6.9e-07 |
42 |
12.4 |
338 |
118 |
1945 |
| Female hormonal tissue or cancer (Breast cancer*) |
Breast cancer* |
6.9e-07 |
42 |
12.4 |
338 |
118 |
1945 |
| Activated B like DLBCL (B lymphoma) |
B lymphoma |
1.4e-06 |
14 |
42.4 |
33 |
30 |
245 |
| Hepatocellular carcinoma (Liver cancer) |
Liver cancer |
2.9e-06 |
52 |
72.2 |
72 |
104 |
207 |
| B cells (Various tumors) |
Various tumors |
8.5e-06 |
22 |
25.5 |
86 |
23 |
154 |
| Adenocarcinoma (Breast cancer*) |
Breast cancer* |
9.3e-06 |
38 |
11.2 |
338 |
112 |
1945 |
| Breast cancer (Breast cancer*) |
Breast cancer* |
9.3e-06 |
38 |
11.2 |
338 |
112 |
1945 |
| Cancer (Breast cancer*) |
Breast cancer* |
9.3e-06 |
38 |
11.2 |
338 |
112 |
1945 |
| Female hormonal cancer (Breast cancer*) |
Breast cancer* |
9.3e-06 |
38 |
11.2 |
338 |
112 |
1945 |
| Cell line (Breast cancer) |
Breast cancer |
1.1e-05 |
19 |
43.1 |
44 |
30 |
152 |
| Liver cancer cell line (Liver cancer) |
Liver cancer |
1.6e-05 |
10 |
13.8 |
72 |
10 |
207 |
| Metastasis (Liver cancer) |
Liver cancer |
1.6e-05 |
10 |
13.8 |
72 |
10 |
207 |
| Breast cancer cell line (Breast cancer) |
Breast cancer |
2.2e-05 |
13 |
29.5 |
44 |
17 |
152 |
| Hematologic samples and cell lines (B lymphoma) |
B lymphoma |
2.5e-05 |
58 |
67.4 |
86 |
121 |
245 |
| CNS tissue, cancer or cell line (Various tumors) |
Various tumors |
3.2e-05 |
20 |
23.2 |
86 |
21 |
154 |
| CNS cancer or cell line (Various tumors) |
Various tumors |
4.5e-05 |
16 |
18.6 |
86 |
16 |
154 |
| CNS tumor (Various tumors) |
Various tumors |
4.5e-05 |
16 |
18.6 |
86 |
16 |
154 |
| Lymphoma (Various tumors) |
Various tumors |
6.1e-05 |
19 |
22.0 |
86 |
20 |
154 |
| Fast doubling (20-40) cell lines (NCI60) |
NCI60 |
0.0001 |
61 |
87.1 |
70 |
90 |
122 |
| Female hormonal tissue, cancer or cell line (Breast cancer*) |
Breast cancer* |
0.0001 |
42 |
12.4 |
338 |
141 |
1945 |
| Cell line (Liver cancer) |
Liver cancer |
0.0001 |
10 |
13.8 |
72 |
11 |
207 |
| Breast tissue, cancer or cell line (Breast cancer*) |
Breast cancer* |
0.0001 |
42 |
12.4 |
338 |
142 |
1945 |
| Lymphoma or lymphoma cell line (B lymphoma) |
B lymphoma |
0.0001 |
31 |
93.9 |
33 |
167 |
245 |
| Female hormonal cancer or cell line (Breast cancer*) |
Breast cancer* |
0.0002 |
38 |
11.2 |
338 |
127 |
1945 |
| Female hormonal cancer cell line (Breast cancer) |
Breast cancer |
0.0002 |
11 |
25 |
44 |
15 |
152 |
| Breast cancer or cell line (Breast cancer*) |
Breast cancer* |
0.0002 |
38 |
11.2 |
338 |
128 |
1945 |
| Cell line (NCI60*) |
NCI60* |
0.0004 |
74 |
9.3 |
792 |
135 |
1945 |
| Enriched GO annotations |
|---|
| For each GO annotation, we tested whether it was enriched in the set of genes of the module. Below we list all such annotations that were enriched in this module with an FDR corrected p-value of 0.05 ('P-value' column), along with the number ('Hits' column) of the module's genes in which they appear. We also show the fraction of the module's genes with the given GO annotation that are included in this module ('Hits (%)' column). For completeness, we also list the total number of genes in the module ('Module genes' column), total number of genes in the compendium in which the corresponding annotation is present ('Genes in annotation' column), and the total number of genes in the compendium ('Genes' column). |
| GO annotation |
P-value |
Hits |
Hits(%) |
Module genes |
Genes in annotation |
Genes |
| oxidoreductase activity |
7.4e-14 |
62 |
14.8 |
417 |
254 |
4566 |
| plasma protein |
8.5e-13 |
17 |
4.0 |
417 |
25 |
4566 |
| microsome |
2.0e-11 |
25 |
5.9 |
417 |
61 |
4566 |
| electron transporter activity |
1.1e-09 |
56 |
13.4 |
417 |
269 |
4566 |
| carboxylic acid metabolism |
2.7e-09 |
36 |
8.6 |
417 |
138 |
4566 |
| organic acid metabolism |
3.4e-09 |
36 |
8.6 |
417 |
139 |
4566 |
| oxidoreductase activity\, acting on paired donors\, with incorporation or reduction of molecular oxygen |
1.5e-08 |
18 |
4.3 |
417 |
44 |
4566 |
| photosynthesis\, light reaction |
1.5e-08 |
31 |
7.4 |
417 |
115 |
4566 |
| electron transport |
6.6e-08 |
32 |
7.6 |
417 |
128 |
4566 |
| photosynthesis |
7.9e-08 |
37 |
8.8 |
417 |
162 |
4566 |
| response to chemical substance |
1.8e-07 |
56 |
13.4 |
417 |
308 |
4566 |
| response to xenobiotic stimulus |
5.8e-07 |
31 |
7.4 |
417 |
133 |
4566 |
| extracellular space |
7.0e-07 |
42 |
10.0 |
417 |
212 |
4566 |
| energy pathways |
1.0e-06 |
40 |
9.5 |
417 |
200 |
4566 |
| cytochrome P450 activity |
1.2e-06 |
9 |
2.1 |
417 |
15 |
4566 |
| blood coagulation |
2.5e-06 |
16 |
3.8 |
417 |
48 |
4566 |
| plasma glycoprotein |
2.6e-06 |
11 |
2.6 |
417 |
24 |
4566 |
| hemostasis |
4.6e-06 |
16 |
3.8 |
417 |
50 |
4566 |
| fatty acid metabolism |
6.9e-06 |
17 |
4.0 |
417 |
57 |
4566 |
| complement activation |
7.0e-06 |
11 |
2.6 |
417 |
26 |
4566 |
| complement activity |
9.3e-06 |
9 |
2.1 |
417 |
18 |
4566 |
| endopeptidase inhibitor activity |
1.1e-05 |
18 |
4.3 |
417 |
65 |
4566 |
| chymotrypsin activity |
1.2e-05 |
15 |
3.5 |
417 |
48 |
4566 |
| monooxygenase activity |
1.3e-05 |
10 |
2.3 |
417 |
23 |
4566 |
| trypsin activity |
2.2e-05 |
15 |
3.5 |
417 |
50 |
4566 |
| carboxylic acid biosynthesis |
2.4e-05 |
12 |
2.8 |
417 |
34 |
4566 |
| serine-type endopeptidase activity |
2.8e-05 |
18 |
4.3 |
417 |
69 |
4566 |
| regulation of complement activation |
3.3e-05 |
10 |
2.3 |
417 |
25 |
4566 |
| defense/immunity protein activity |
3.6e-05 |
23 |
5.5 |
417 |
103 |
4566 |
| oxidoreductase activity\, acting on paired donors\, with incorporation or reduction of molecular oxygen\, reduced flavin or flavoprotein as one donor\, and incorporation of one atom of oxygen |
3.7e-05 |
6 |
1.4 |
417 |
9 |
4566 |
| blood coagulation factor activity |
8.5e-05 |
6 |
1.4 |
417 |
10 |
4566 |
| organic acid biosynthesis |
9.7e-05 |
11 |
2.6 |
417 |
33 |
4566 |
| oxidoreductase activity\, acting on the CH-NH group of donors\, NAD or NADP as acceptor |
0.0001 |
5 |
1.1 |
417 |
7 |
4566 |
| vitamin binding |
0.0001 |
11 |
2.6 |
417 |
34 |
4566 |
| Visual display |
|---|
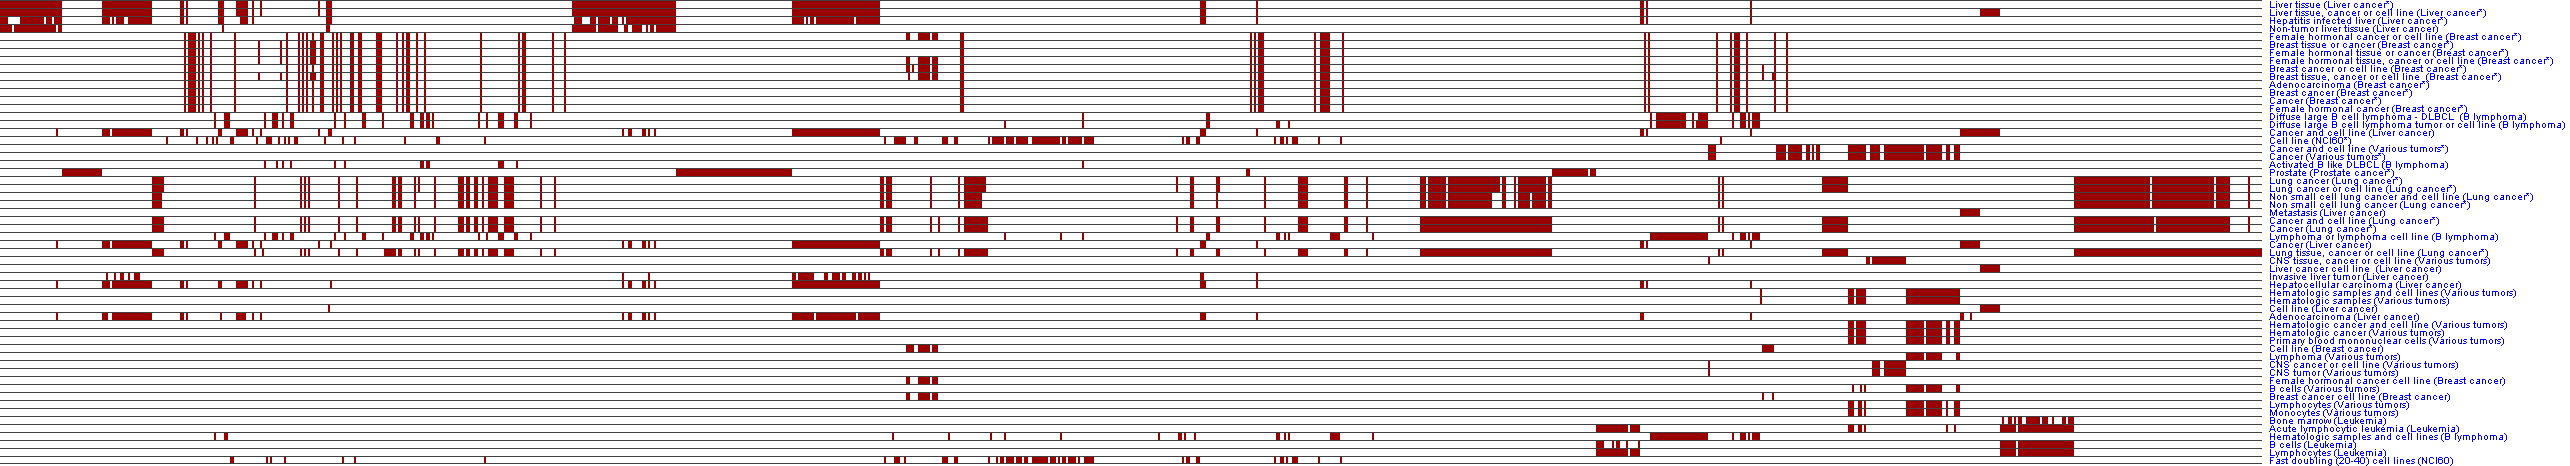
| Below is a visual display of the module. Shown are those arrays in which the module's genes significantly change, and the direction of change (induction/repression) in each array is indicated (middle, labeled 'Module changes'; red/green row). The arrays that correspond to the significant clinical attributes are also shown (top; brown rows). The gene sets that compose the module are also shown (left) along with an indication of the membership of the module genes in these gene sets. |
| You can also view the images within GeneXPress by loading the module gxp file file. |
| Note: Since there are 565 genes, this image does not display the individual gene names, but rather condenses each gene to a single pixel without displaying its name. You can fully view the image for this module within GeneXPress, by loading any of the four files mentioned in the line above. |
| Note: Since there are 1131 experiments, this image does not display the individual experiment names, but rather condenses each experiment to a single pixel without displaying its name. You can fully view the image for this module within GeneXPress, by loading any of the four files mentioned in the line above |
|
 |
|
|
 >4x >4x | |
|