| | ||||
 |
|
|||
 >4x >4x |
Module 32 |
| General Properties | |
|---|---|
| Below we list the number of gene sets from which the module was composed was originally composed, and the number of genes and experiments that it contains. Clicking on the number of genes will display a detailed list of all the genes in the module. Clicking on the number of experiments will display a detailed list of all the experiments in the module. | |
| Num gene sets: | 3 |
| Num genes: | 241 (see 2270 additional genes for this module) |
| Num experiments: | 249 (116 induced, 133 repressed) |
| Parent module: | 83 |
| Children modules: | None |
| Gene sets | |
|---|---|
| Below we list the gene sets from which the module was originally composed. Clicking on a gene set will display all the genes associated with that gene set. Also listed are all the other modules in which the gene set participates. | |
| nucleic acid binding | |
| nuclease activity | |
| RNA binding | |
| Enriched clinical annotations | |||||||
|---|---|---|---|---|---|---|---|
| For each of the clinical annotations, we tested whether it was enriched in the set of arrays in which the module is significantly induced (or repressed). Below we list all such annotations that were enriched in this module with an FDR corrected p-value of 0.05 ('P-value' column), along with the number ('Hits' column) of induced (or repressed) module's arrays in which they appear. We also show the fraction of the module's induced (or repressed) arrays with the given annotation ('Hits (%)' column). For completeness, we also list the total number of relevant induced arrays in the module ('Module hits in category' column), total number of arrays in the compendium in which the corresponding annotation is present ('Arrays in annotation' column), and the total number of relevant arrays in the compendium ('Arrays' column). Note that the 'relevant' arrays may be different for each annotation, since it includes only arrays in which the annotation was relevant (i.e., present or not present) and excludes arrays where the value of the annotation was not known. Rows that correspond to annotations that were enriched in the induced arrays of the module have a red background, while rows corresponding to annotations enriched in the repressed arrays have a green background. For each annotation, we also list the other modules in which it was enriched. | |||||||
| Clinical annotation | Category | P-value | Hits | Hits(%) | Module hits in category | Arrays in annotation | Arrays |
| Prostate (Prostate cancer*) | Prostate cancer* | 8.9e-20 | 37 | 27.8 | 133 | 101 | 1945 |
| Hematologic cancer and cell line (Stimulated immune*) | Stimulated immune* | 2.1e-13 | 21 | 18.1 | 116 | 53 | 1945 |
| Hematologic samples and cell lines (Stimulated immune*) | Stimulated immune* | 2.1e-13 | 21 | 18.1 | 116 | 53 | 1945 |
| Macrophages (Stimulated immune*) | Stimulated immune* | 2.1e-13 | 21 | 18.1 | 116 | 53 | 1945 |
| Monocytes (Stimulated immune*) | Stimulated immune* | 2.1e-13 | 21 | 18.1 | 116 | 53 | 1945 |
| CNS tissue, cancer or cell line (Neuro tumors*) | Neuro tumors* | 1.4e-08 | 22 | 16.5 | 133 | 85 | 1945 |
| Hematologic cancer and cell line (Stimulated immune*) | Stimulated immune* | 2.2e-08 | 17 | 12.7 | 133 | 53 | 1945 |
| Hematologic samples and cell lines (Stimulated immune*) | Stimulated immune* | 2.2e-08 | 17 | 12.7 | 133 | 53 | 1945 |
| Macrophages (Stimulated immune*) | Stimulated immune* | 2.2e-08 | 17 | 12.7 | 133 | 53 | 1945 |
| Monocytes (Stimulated immune*) | Stimulated immune* | 2.2e-08 | 17 | 12.7 | 133 | 53 | 1945 |
| CNS cancer or cell line (Neuro tumors*) | Neuro tumors* | 1.6e-07 | 20 | 15.0 | 133 | 81 | 1945 |
| CNS tumor (Neuro tumors*) | Neuro tumors* | 1.6e-07 | 20 | 15.0 | 133 | 81 | 1945 |
| Cancer and cell line (Neuro tumors*) | Neuro tumors* | 4.8e-07 | 20 | 15.0 | 133 | 86 | 1945 |
| Cancer (Neuro tumors*) | Neuro tumors* | 4.8e-07 | 20 | 15.0 | 133 | 86 | 1945 |
| Breast tissue or cancer (NCI60) | NCI60 | 3.6e-05 | 3 | 75 | 4 | 4 | 139 |
| Female hormonal tissue or cancer (NCI60) | NCI60 | 3.6e-05 | 3 | 75 | 4 | 4 | 139 |
| Liver cancer cell line (Liver cancer) | Liver cancer | 4.4e-05 | 6 | 31.5 | 19 | 10 | 207 |
| Atypical teratoid/rhabdoid tumour - CNS and other origin (Neuro tumors) | Neuro tumors | 5.9e-05 | 6 | 60 | 10 | 10 | 90 |
| Cell line (Liver cancer) | Liver cancer | 9.2e-05 | 6 | 31.5 | 19 | 11 | 207 |
| Adenocarcinoma (Prostate cancer) | Prostate cancer | 0.0001 | 12 | 100 | 12 | 52 | 102 |
| Cancer and cell line (Prostate cancer) | Prostate cancer | 0.0001 | 12 | 100 | 12 | 52 | 102 |
| Cancer (Prostate cancer) | Prostate cancer | 0.0001 | 12 | 100 | 12 | 52 | 102 |
| Prostate cancer or cell line (Prostate cancer) | Prostate cancer | 0.0001 | 12 | 100 | 12 | 52 | 102 |
| Prostate cancer (Prostate cancer) | Prostate cancer | 0.0001 | 12 | 100 | 12 | 52 | 102 |
| Renal cancer or cell line (Neuro tumors) | Neuro tumors | 0.0003 | 4 | 40 | 10 | 5 | 90 |
| Renal tissue (Neuro tumors) | Neuro tumors | 0.0003 | 4 | 40 | 10 | 5 | 90 |
| Squamous cell lung cancer (Lung cancer) | Lung cancer | 0.0004 | 5 | 71.4 | 7 | 35 | 276 |
| Enriched GO annotations | ||||||
|---|---|---|---|---|---|---|
| For each GO annotation, we tested whether it was enriched in the set of genes of the module. Below we list all such annotations that were enriched in this module with an FDR corrected p-value of 0.05 ('P-value' column), along with the number ('Hits' column) of the module's genes in which they appear. We also show the fraction of the module's genes with the given GO annotation that are included in this module ('Hits (%)' column). For completeness, we also list the total number of genes in the module ('Module genes' column), total number of genes in the compendium in which the corresponding annotation is present ('Genes in annotation' column), and the total number of genes in the compendium ('Genes' column). | ||||||
| GO annotation | P-value | Hits | Hits(%) | Module genes | Genes in annotation | Genes |
| nucleic acid binding | 2.3e-277 | 241 | 100 | 241 | 444 | 4566 |
| RNA binding | 7.9e-153 | 153 | 63.4 | 241 | 249 | 4566 |
| nuclease activity | 5.3e-128 | 132 | 54.7 | 241 | 215 | 4566 |
| protein biosynthesis | 4.4e-88 | 94 | 39.0 | 241 | 151 | 4566 |
| hydrolase activity | 2.8e-66 | 157 | 65.1 | 241 | 783 | 4566 |
| translation regulator activity | 6.7e-63 | 82 | 34.0 | 241 | 172 | 4566 |
| ribonucleoprotein complex | 2.3e-61 | 99 | 41.0 | 241 | 283 | 4566 |
| translation factor activity\, nucleic acid binding | 1.1e-56 | 71 | 29.4 | 241 | 139 | 4566 |
| structural constituent of ribosome | 7.2e-55 | 56 | 23.2 | 241 | 81 | 4566 |
| RNA processing | 4.5e-39 | 50 | 20.7 | 241 | 99 | 4566 |
| RNA metabolism | 2.6e-34 | 45 | 18.6 | 241 | 92 | 4566 |
| ribosome | 3.0e-34 | 62 | 25.7 | 241 | 194 | 4566 |
| large ribosomal subunit | 3.7e-33 | 29 | 12.0 | 241 | 34 | 4566 |
| cytosolic large ribosomal subunit (sensu Eukarya) | 6.6e-29 | 25 | 10.3 | 241 | 29 | 4566 |
| cytosolic small ribosomal subunit (sensu Eukarya) | 2.1e-26 | 23 | 9.5 | 241 | 27 | 4566 |
| mRNA binding | 3.3e-26 | 29 | 12.0 | 241 | 47 | 4566 |
| translation release factor activity | 5.2e-26 | 38 | 15.7 | 241 | 90 | 4566 |
| catalytic activity | 3.6e-24 | 164 | 68.0 | 241 | 1677 | 4566 |
| RNA splicing | 7.7e-24 | 31 | 12.8 | 241 | 63 | 4566 |
| translation initiation factor activity | 8.0e-24 | 23 | 9.5 | 241 | 31 | 4566 |
| small ribosomal subunit | 2.7e-23 | 23 | 9.5 | 241 | 32 | 4566 |
| mRNA splicing | 1.3e-22 | 27 | 11.2 | 241 | 49 | 4566 |
| pre-mRNA splicing factor activity | 1.8e-21 | 23 | 9.5 | 241 | 36 | 4566 |
| GTP binding | 4.6e-21 | 37 | 15.3 | 241 | 111 | 4566 |
| mRNA processing | 3.3e-17 | 21 | 8.7 | 241 | 40 | 4566 |
| regulation of translational initiation | 3.5e-17 | 16 | 6.6 | 241 | 21 | 4566 |
| translational elongation | 5.3e-16 | 14 | 5.8 | 241 | 17 | 4566 |
| translational initiation | 1.4e-15 | 17 | 7.0 | 241 | 28 | 4566 |
| GTPase activity | 5.1e-14 | 26 | 10.7 | 241 | 85 | 4566 |
| translation elongation factor activity | 1.4e-13 | 12 | 4.9 | 241 | 15 | 4566 |
| spliceosome complex | 4.8e-13 | 14 | 5.8 | 241 | 23 | 4566 |
| hydrolase activity\, acting on acid anhydrides\, in phosphorus-containing anhydrides | 5.5e-12 | 28 | 11.6 | 241 | 118 | 4566 |
| single-stranded RNA binding | 8.4e-12 | 10 | 4.1 | 241 | 12 | 4566 |
| heterogeneous nuclear ribonucleoprotein | 3.4e-11 | 10 | 4.1 | 241 | 13 | 4566 |
| small nuclear ribonucleoprotein | 3.4e-11 | 10 | 4.1 | 241 | 13 | 4566 |
| small monomeric GTPase activity | 1.0e-10 | 19 | 7.8 | 241 | 61 | 4566 |
| eukaryotic 43S pre-initiation complex | 4.6e-10 | 8 | 3.3 | 241 | 9 | 4566 |
| single-stranded DNA binding | 7.7e-10 | 11 | 4.5 | 241 | 20 | 4566 |
| eukaryotic translation initiation factor 3 complex | 1.0e-09 | 7 | 2.9 | 241 | 7 | 4566 |
| small nucleolar ribonucleoprotein complex | 2.2e-09 | 8 | 3.3 | 241 | 10 | 4566 |
| transcription from Pol I promoter | 2.9e-08 | 13 | 5.3 | 241 | 38 | 4566 |
| small GTPase mediated signal transduction | 3.5e-08 | 20 | 8.2 | 241 | 92 | 4566 |
| DNA binding | 3.6e-07 | 42 | 17.4 | 241 | 357 | 4566 |
| double-stranded DNA binding | 6.6e-07 | 7 | 2.9 | 241 | 12 | 4566 |
| nucleolus | 1.2e-06 | 12 | 4.9 | 241 | 43 | 4566 |
| telomeric DNA binding | 1.3e-06 | 7 | 2.9 | 241 | 13 | 4566 |
| chromatin binding | 2.4e-06 | 8 | 3.3 | 241 | 19 | 4566 |
| RAB small monomeric GTPase activity | 3.8e-06 | 8 | 3.3 | 241 | 20 | 4566 |
| eukaryotic translation initiation factor 4 complex | 7.5e-06 | 5 | 2.0 | 241 | 7 | 4566 |
| signal recognition particle | 3.6e-05 | 4 | 1.6 | 241 | 5 | 4566 |
| spliceosome assembly | 4.1e-05 | 5 | 2.0 | 241 | 9 | 4566 |
| DNA metabolism | 6.2e-05 | 22 | 9.1 | 241 | 169 | 4566 |
| nucleus | 7.0e-05 | 76 | 31.5 | 241 | 966 | 4566 |
| tRNA binding | 0.0001 | 4 | 1.6 | 241 | 6 | 4566 |
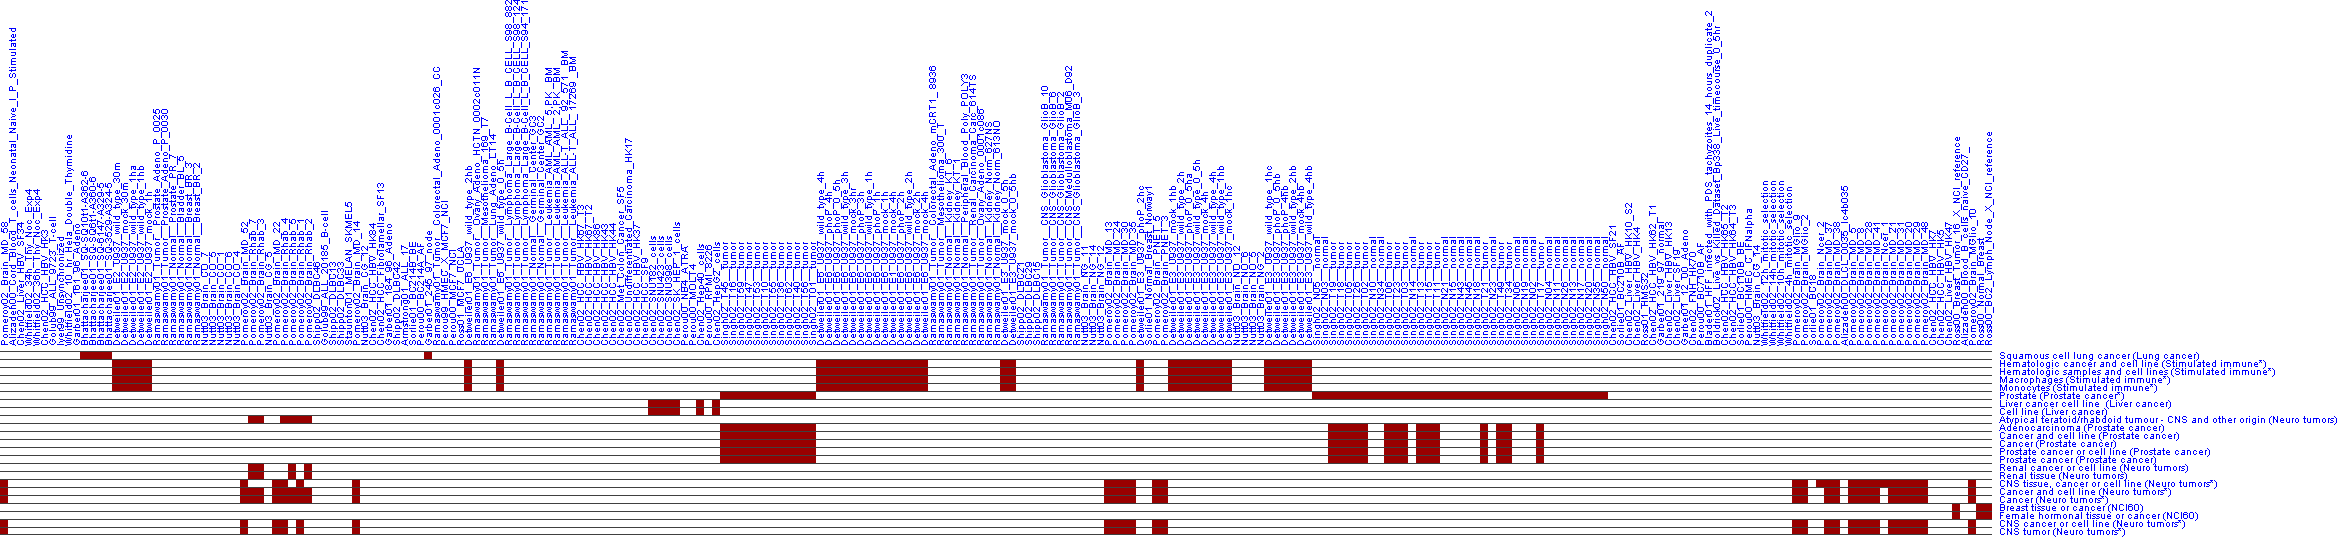
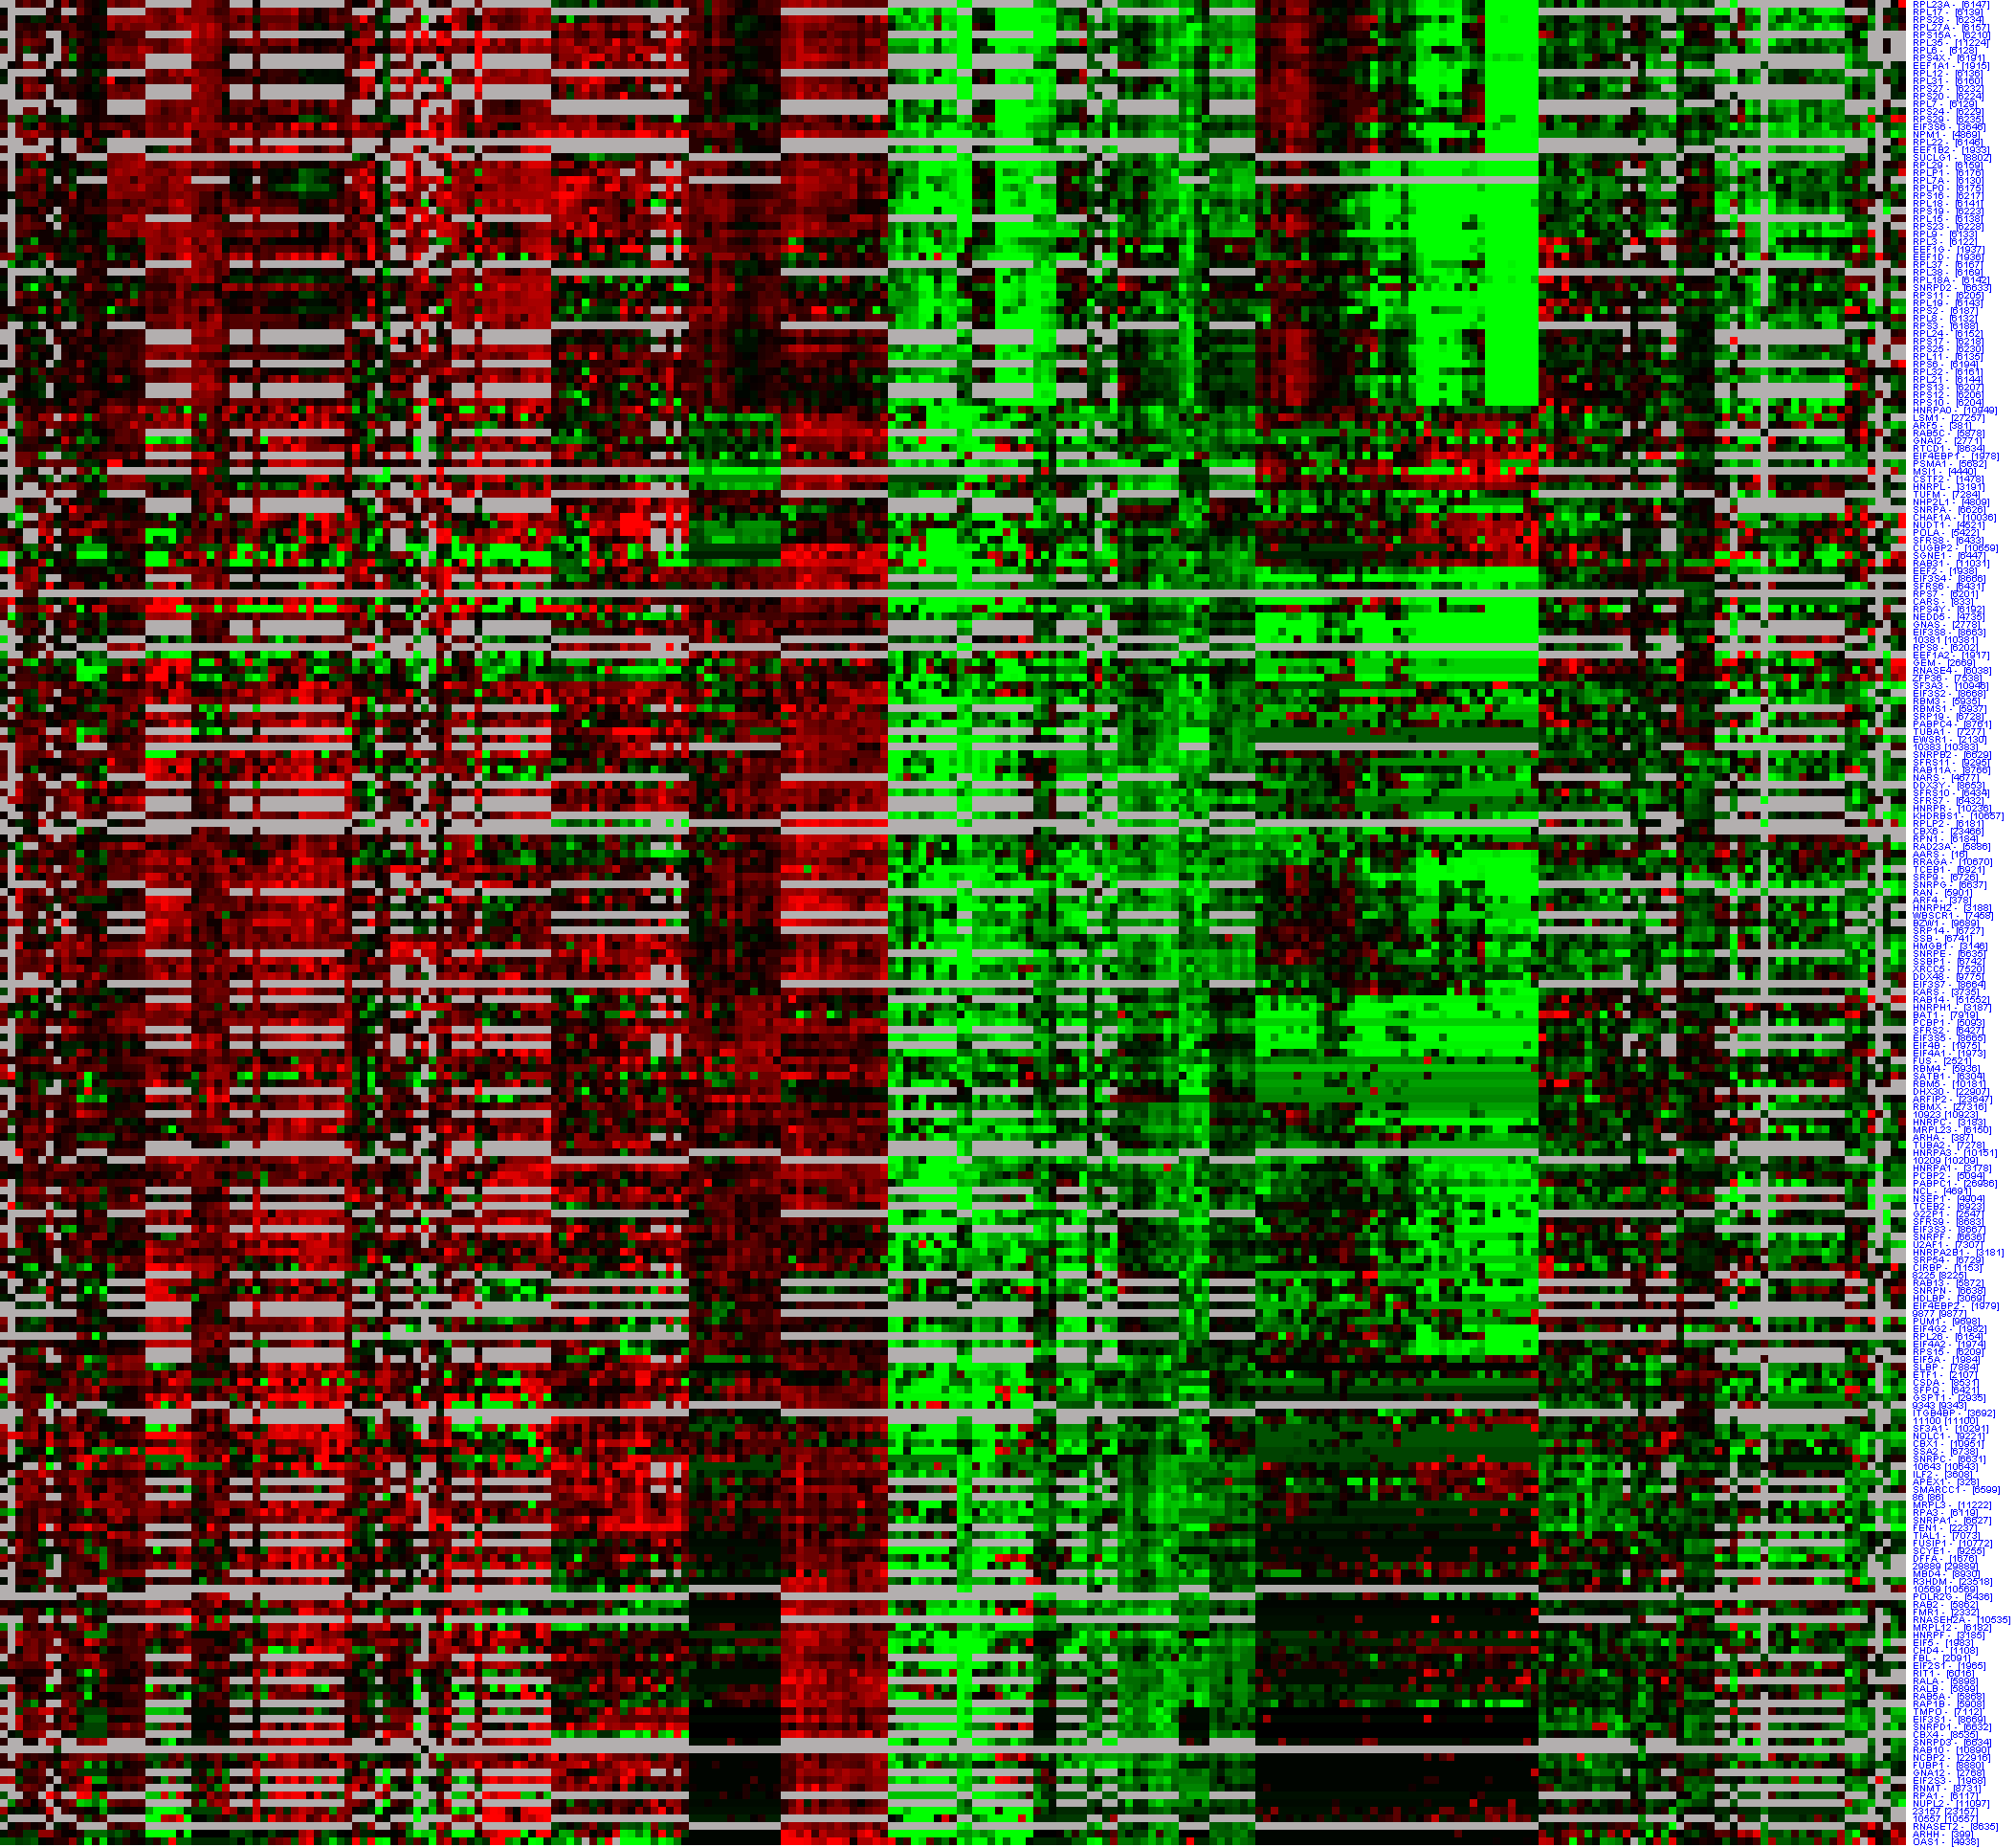
| Visual display | |||||||||
|---|---|---|---|---|---|---|---|---|---|
| Below is a visual display of the module. Shown are those arrays in which the module's genes significantly change, and the direction of change (induction/repression) in each array is indicated (middle, labeled 'Module changes'; red/green row). The arrays that correspond to the significant clinical attributes are also shown (top; brown rows). The gene sets that compose the module are also shown (left) along with an indication of the membership of the module genes in these gene sets. | |||||||||
| You can also view the images within GeneXPress by loading the module gxp file file. | |||||||||
|
|||||||||