Home
Search
Browse results Datasets
Figures
Clinical annotations
Overview of results GeneXPress
GeneSets
Links
People
Supplemental Information
|
Global overview of results Below we show how the significant array-gene set pairs are distributed, broken down by the type of conditions represented by the various arrays. Gene sets corresponding to processes or pathways Shown is the fraction of all array-gene set pairs where the gene set significantly changes in expression, out of the total possible array-gene sets pairs for the arrays of each condition. High fractions indicate that the gene sets are more informative of the corresponding conditions. 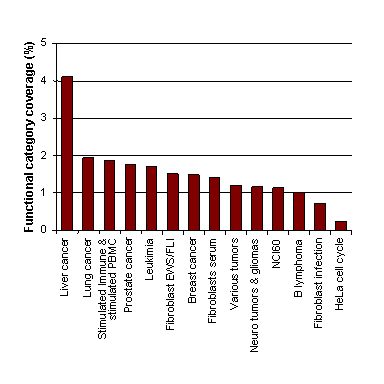 Below is the specificity and the generality of the gene set in terms of the number of distinct conditions in which they significantly change. Shown is the number of gene sets (y-axis) that are significant in a particular number of conditions (x-axis). While most gene sets are specific to a small number of conditions, some are informative in many different conditions (e.g., cell cycle). 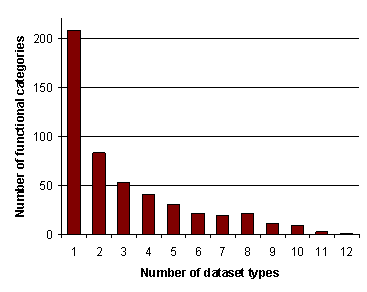 Gene sets corresponding to tissue specific expression Shown is the fraction of all array-gene set pairs where the gene set significantly changes in expression, out of the total possible array-gene sets pairs for the arrays of each condition. High fractions indicate that the gene sets are more informative of the corresponding conditions. 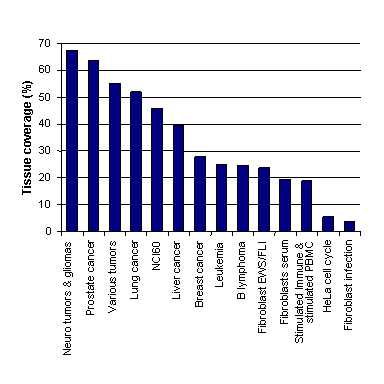 Below is the specificity and the generality of the gene set in terms of the number of distinct conditions in which they significantly change. Shown is the number of gene sets (y-axis) that are significant in a particular number of conditions (x-axis). While most gene sets are specific to a small number of conditions, some are informative in many different conditions (e.g., cell cycle). 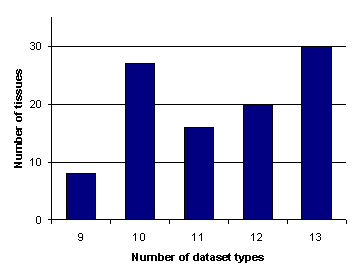 Gene sets corresponding to co-expressed gene clusters Shown is the fraction of all array-gene set pairs where the gene set significantly changes in expression, out of the total possible array-gene sets pairs for the arrays of each condition. High fractions indicate that the gene sets are more informative of the corresponding conditions. 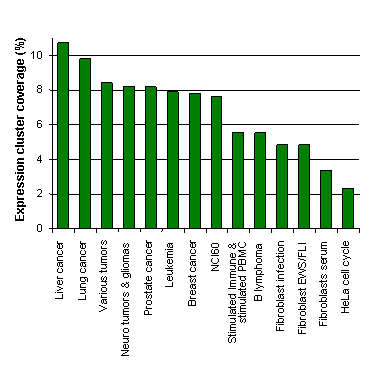 Below is the specificity and the generality of the gene set in terms of the number of distinct conditions in which they significantly change. Shown is the number of gene sets (y-axis) that are significant in a particular number of conditions (x-axis). While most gene sets are specific to a small number of conditions, some are informative in many different conditions (e.g., cell cycle). 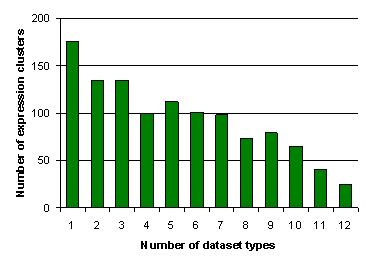 |